 Blaze2D
Introduction
Blaze2D computes photonic bands and projected Maxwell operators for two-dimensional periodic dielectric structures. It is written in Rust and available through Python, TOML files, a native command, and the browser Workbench.
This page builds the physical picture those calculations rest on: what makes a crystal photonic, how a repeating structure is described, and what a band structure actually reports.
What makes a crystal photonic?
A photonic crystal is a material whose dielectric permittivity repeats in space. Alternating glass and air layers are a simple example. Light scattered by the repeated interfaces interferes, allowing some waves to travel through the structure while excluding others. The pattern and dielectric contrast determine that response.
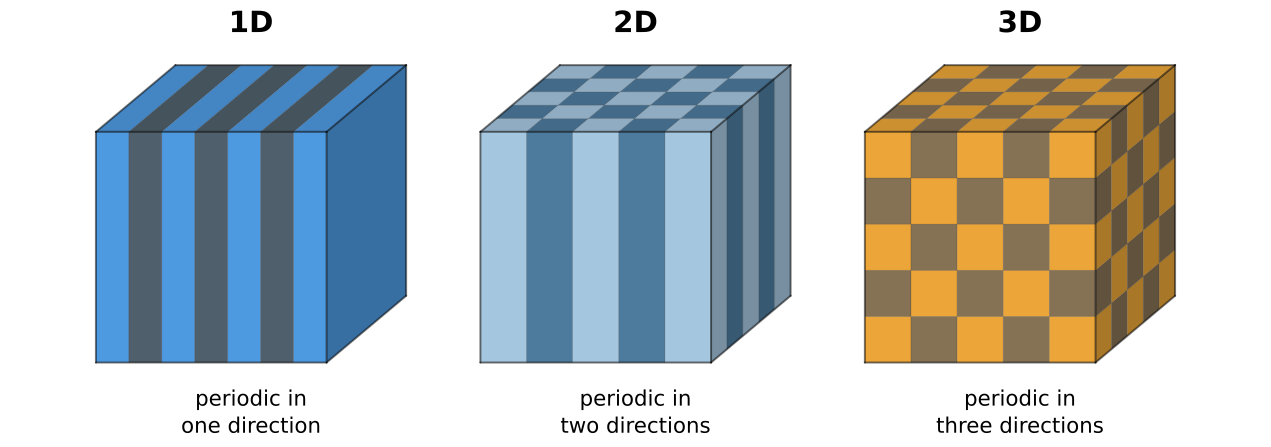 Open full size in a new tab
 To describe a repeating pattern, separate its lattice from its basis. The lattice specifies the translations: integer steps along two primitive vectors, and . The basis is the arrangement of objects repeated at each lattice point. There are five Bravais lattice types in two dimensions.
Place a dielectric rod at every point, or an air hole in a uniform dielectric, and the lattice becomes a photonic crystal. A basis can also contain several objects. For example, a honeycomb pattern uses a triangular lattice with two sites per cell. The lattice sets the translations; the basis, object sizes, and materials set the permittivity within each cell.
Why does light form bands?
The geometry enters Maxwell's equations through the relative permittivity . For a lossless, nonmagnetic material without frequency dispersion, the magnetic field obeys the photonic master equation:
Here is a mode's magnetic field, its angular frequency, and the speed of light in vacuum. This is an eigenvalue problem: find the field patterns whose shape is unchanged by the operator on the left. The scale factor is the eigenvalue .
If you know electronic band theory, the connection is direct. A periodic potential acts on an electron's wavefunction in the Schrödinger equation. A periodic permittivity acts on an electromagnetic field in Maxwell's equations. Both admit Bloch waves and bands, although the fields, operators, and physical observables differ.
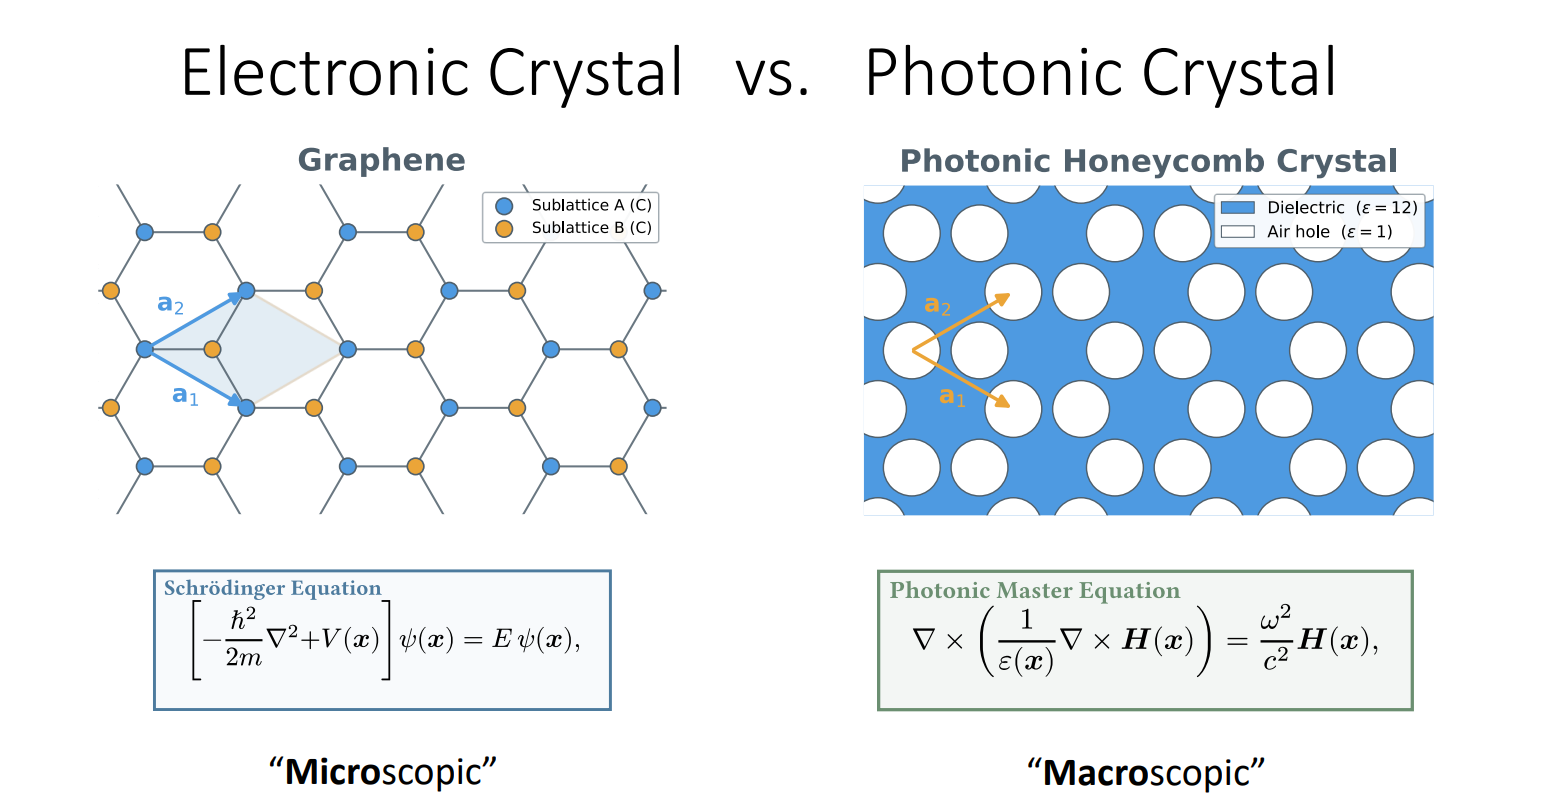 Open full size in a new tab
 Periodicity lets us write each mode as a plane wave multiplied by a function that repeats in every cell:
The Bloch wavevector sets the phase change from cell to cell. For each , the master equation gives a sequence of allowed frequencies. Following the th frequency as changes gives a band, .
How do I read a band diagram?
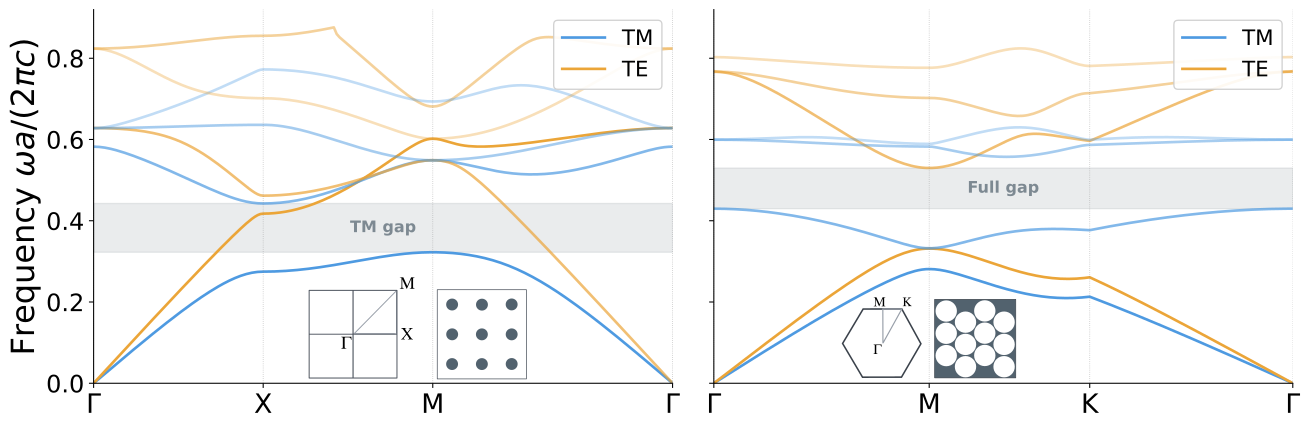
A band diagram plots those frequencies along a path through the Brillouin zone, the region of distinct Bloch wavevectors. Labels such as , , , and mark points of lattice symmetry. The horizontal axis is a path in wavevector space, not a position inside the crystal.
 Open full size in a new tab
 Each curve is one allowed mode frequency. The vertical axis uses , where is the lattice constant and the vacuum wavelength. This normalization makes the diagram independent of the overall scale of a nondispersive crystal.
The blue curves are TM modes, with the electric field along the invariant direction. Orange curves are TE modes, with the magnetic field in that direction. On the left, the shaded interval excludes TM modes but still contains TE modes. On the right, the shaded interval is shared by both polarizations. A complete band gap requires an absence of modes throughout the Brillouin zone, so checking only the plotted path is not sufficient to establish it.
Band slopes also carry information: gives the group velocity. A flatter band means slower propagation in the corresponding direction. These frequencies and field patterns are the basic results returned by a band solver.
How does Blaze solve the equation?
MPB and Blaze use a plane-wave expansion (PWE). Once the Bloch phase is separated out, the remaining field is periodic. It can therefore be represented by a finite set of Fourier components, labelled by reciprocal lattice vectors :
For Blaze's 2D scalar problems, is the periodic part of for TE or for TM. The coefficients are the unknowns. represents the differential operator; is the identity for TE and the dielectric weight for TM. An iterative eigensolver finds the requested bands at each wavevector. Increasing the grid resolution adds Fourier components, and convergence checks show whether the chosen resolution is sufficient.
- 01Define the cellLattice, objects, permittivity
- 02Solve at each kPeriodic fields and frequencies
- 03Trace the bandsDispersion, gaps, mode profiles
Blaze currently supports two-dimensional circles and positive scalar dielectric materials. This covers rods, holes, and multi-object bases on any 2D Bravais lattice. Its rods and holes extend uniformly along the third direction.
Why calculate many different crystals?
One band diagram answers a question about one configuration. Designing a crystal or building a model often requires a parameter study: repeat the calculation while changing the geometry or material.
In many short solves, geometry setup can become a substantial repeated cost. MPB's geometry initialization samples and averages the dielectric near interfaces. Blaze targets this overhead with specialized circle geometry and analytic boundary area fractions, and schedules independent configurations across CPU cores. Its ordered sweeps retain the parameter values alongside each result.
The technical report compares complete calculation times against MPB under stated settings. Those timings include both setup and solving; the benefit depends on the geometry, resolution, and number of requested bands.
What can operator data tell us?
A band diagram shows where the modes lie. It does not, by itself, tell us how two modes couple when a structure changes. That requires matrix elements of the operator and its derivatives between the computed fields.
MPB already exposes frequencies, electromagnetic fields, raw eigenvectors, and group velocities through its Python interface. It does not provide Blaze's prepared collection of projected derivative matrices and associated coordinate and phase-convention metadata. Deriving these from MPB output requires an additional extraction workflow.
Both solvers use matrix-free operator application: they evaluate for a trial field without storing the full matrix . Fourier transforms connect spatial derivatives to material multiplication. This saves memory, and it still allows small projected matrices to be computed by applying an operator to selected fields and taking their inner products.
For example, let be the periodic TE operator. A parameter such as a wavevector component or an object's displacement gives the derivative matrix
Here the fields are normalized within the unit cell. Away from degeneracies, diagonal entries describe the first-order change in an eigenvalue; off-diagonal entries describe mixing between different modes. Near a degeneracy, the coupled bands must be treated together.
| Data available in Blaze | Physical use |
|---|---|
| Wavevector derivatives and curvature matrices | Propagation, coupling between bands, and effective masses understood as band curvature |
| Derivatives with respect to object displacement | Perturbations caused by changing the relative alignment of objects in a cell |
| Cross-band matrix elements and overlaps between sampled states | Reduced models that retain selected bands and track changes in their basis |
For TM, the dielectric weight and its derivatives must also be included; Blaze records those separately. The operator reference specifies the available quantities and conventions.
This is the connection to the master's thesis. A twisted photonic crystal can be described through many locally periodic crystals whose alignment changes slowly in space. Their bands supply the local frequencies. Their projected operator data supply coefficients for an effective model of the slow variation. Blaze was built to make both parts of that calculation practical.
To calculate a first band diagram, open an example or follow the installation guide.