Facial Emotion Recognition

Seven architectures on one clean face dataset: how much does each gain from tuning, and how small can the best get?

Methods
  • PyTorch
  • Optuna (TPE)
  • fANOVA
  • Data cleaning
  • GPU augmentation
  • Warmup-stable-decay
  • Neural collapse
  • Low-rank factorisation
  • Tucker-2
  • int8 quantisation
A grayscale test face beside a bar chart of DenseNet’s probability for each of seven emotions; after each face a color map fades in over it, brightest where graying out the face lowers DenseNet’s confidence the most: the mouth corners, the eyebrows, the nose
DenseNet on five FER2013 test faces. In color: how much its confidence in its answer drops when the face is grayed out there, 6 × 6 pixels at a time; from dark (no drop) to yellow (the largest).

Overview

How much does each architecture gain from tuning?

And how far can the best go with longer training, late generalisation, and compression?

A FER2013 test face

A face labeled happy, 48 by 48 pixels

10 of 10 annotators said happy.

Runs on your device; nothing is uploaded.Privacy noteYour photos and camera pictures stay on your device. “Upload” only opens a photo in this page: the networks run here in your browser, and nothing is sent anywhere. The website’s code is public, so anyone can check this.

0%25%50%75%100%Simple CNN, angry: 5.0%VGG, angry: 1.9%ResNet-18, angry: 2.3%DenseNet, angry: 0.1%ViT, angry: 3.1%ConvNeXt, angry: 0.2%CCT, angry: 2.1%angrySimple CNN, disgust: 5.2%VGG, disgust: 3.4%ResNet-18, disgust: 3.1%DenseNet, disgust: 0.0%ViT, disgust: 2.7%ConvNeXt, disgust: 0.7%CCT, disgust: 1.8%disgustSimple CNN, fear: 7.4%VGG, fear: 3.6%ResNet-18, fear: 4.1%DenseNet, fear: 0.7%ViT, fear: 3.7%ConvNeXt, fear: 0.6%CCT, fear: 2.1%fearSimple CNN, happy: 72.0%VGG, happy: 88.0%ResNet-18, happy: 80.5%DenseNet, happy: 99.1%ViT, happy: 82.7%ConvNeXt, happy: 97.6%CCT, happy: 87.9%happyannotatorsSimple CNN, neutral: 0.6%VGG, neutral: 0.5%ResNet-18, neutral: 0.7%DenseNet, neutral: 0.2%ViT, neutral: 2.4%ConvNeXt, neutral: 0.3%CCT, neutral: 1.9%neutralSimple CNN, sad: 2.5%VGG, sad: 1.2%ResNet-18, sad: 7.4%DenseNet, sad: 0.0%ViT, sad: 2.7%ConvNeXt, sad: 0.4%CCT, sad: 2.1%sadSimple CNN, surprise: 7.3%VGG, surprise: 1.4%ResNet-18, surprise: 1.8%DenseNet, surprise: 0.0%ViT, surprise: 2.7%ConvNeXt, surprise: 0.3%CCT, surprise: 2.1%surprise
One face, seven networks: the bars are each network’s probability for each emotion. A FER2013 test face to start; your own photo or a camera snapshot runs through the same networks, in your browser.

From a course project to a proper study

The study began in 2024 as a course project with a fellow student: one DenseNet, tuned and compared with a plain CNN on FER2013. That project had serious flaws in training and validation: the DenseNet was trained on the test images, the hyperparameter search minimised the training loss, and the two networks were scored on different versions of the data.

In 2026 I picked it up again and rebuilt it from scratch, with what I had learned in the two years since. The dataset grew and was cleaned: FER2013 with its FER+ votes, merged with RAF-DB. Seven architectures instead of two, each with the same pipeline and the same tuning budget, every decision made on the validation set. Then the study went where it got interesting: tuning, grokking, and compression.

How the study ran

Data: two public datasets merged and cleaned into 44,296 faces. Architectures: seven, from a plain CNN to a vision transformer, all trained from scratch. Tuning: 30 Optuna trials each, then the network's shape for the three winners.

Grokking: the three winners trained far longer, then the setting where grokking was shown on images. Compression: four methods, alone and combined, against networks trained small from scratch.

The study rebuilds an earlier course project from scratch, after that project's evaluation turned out to be invalid. Nothing from it is reused.

Part 01 of 05Data

Can two noisy face datasets be merged into one clean, more balanced set?

angryangry, FER2013 (FER+ labels): 1,797angry, RAF-DB: 6252,422disgustdisgust, FER2013 (FER+ labels): 81disgust, RAF-DB: 637718 (×8.9)fearfear, FER2013 (FER+ labels): 378fear, RAF-DB: 250628happyhappy, FER2013 (FER+ labels): 7,043happy, RAF-DB: 4,25411,297neutralneutral, FER2013 (FER+ labels): 8,580neutral, RAF-DB: 2,24810,828sadsad, FER2013 (FER+ labels): 2,714sad, RAF-DB: 1,7494,463surprisesurprise, FER2013 (FER+ labels): 2,330surprise, RAF-DB: 1,1413,47102,5005,0007,50010,000training faces
  • FER2013 (FER+ labels)
  • RAF-DB
Training faces per emotion. RAF-DB adds the most where FER2013 is thinnest.

FER2013 has 35,887 faces with FER+ labels: ten votes per face. RAF-DB adds faces from the web, and the most where FER2013 is thinnest: disgust grows from 81 to 718 training faces.

Cleaning

A face was dropped when the annotators disagreed, when it was a near-duplicate (perceptual hash), or when its label was not one of the seven emotions. Duplicates never cross the train, validation and test split. 44,296 faces remain.

annotators disagreeannotators disagree, removed: 3,6563,656duplicateduplicate, removed: 2,3992,399duplicate, conflicting labelsduplicate, conflicting labels, removed: 260260labelled unknownlabelled unknown, removed: 222222contempt (8th class)contempt (8th class), removed: 216216removed by FER+removed by FER+, removed: 173173not a facenot a face, removed: 4401,0002,0003,000faces removed
Faces removed in cleaning, by reason, from both datasets.

One format

All faces are 48 × 48 pixels in grayscale. RAF-DB faces were cropped to match FER2013's looser framing.

Augmentation runs on the GPU: flips, small rotations and shifts, brightness and contrast, and random erasing.
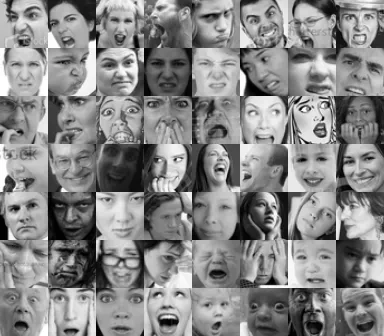
A grid of 56 small grayscale faces from FER2013, eight per row, one row per emotion: angry, disgust, fear, happy, neutral, sad, surprise
Random training faces from FER2013, 48 × 48 pixels. RAF-DB images are not shown: they may not be redistributed.

Part 02 of 05Architectures

Which architecture recognises emotions best, with its defaults and after tuning?

70758085test accuracy (%)ViT, default: 71.8%ConvNeXt, default: 76.9%Simple CNN, default: 78.2%CCT, default: 78.0%DenseNet, default: 84.3%VGG, default: 84.3%ResNet-18, default: 85.0%ViT, tuned: 78.4% (+6.6)ConvNeXt, tuned: 80.1% (+3.2)Simple CNN, tuned: 81.2% (+3.0)CCT, tuned: 81.6% (+3.6)DenseNet, tuned: 84.6% (+0.3)VGG, tuned: 84.7% (+0.4)ResNet-18, tuned: 85.1% (+0.1)+6.6+3.2+3.0+3.6+0.3+0.4+0.1ViTConvNeXtSimple CNNCCTDenseNetVGGResNet-18ResNet-18, ImageNet-pretrained (reference)
  • default settings
  • after tuning
  • ImageNet-pretrained ResNet-18
Test accuracy with default settings (ring) and after tuning (dot), mean of the final runs. The number is the gain from tuning, in points.

Seven architectures, all trained from scratch on the same faces with the same pipeline. Batch norm decides the ranking: ResNet-18, VGG and DenseNet lead at about 85% and gain little from tuning. Tuning shrinks the spread between the models from 13 to 7 points.

Training curves

Each model trains 60 epochs with AdamW, a warmup, and a cosine decay. Validation accuracy settles in the last epochs, and the validation loss never turns up: no model overfits.

Validation accuracy

4060801102030405060epochlearning rate decaysto zero (cosine)

Validation loss

0.500.751.001.251.501102030405060epochno upturn:no overfitting
  • ResNet-18
  • VGG
  • DenseNet
  • CCT
  • Simple CNN
  • ConvNeXt
  • ViT
Training curves with default settings, mean of two seeds. Augmentation, label smoothing and a decaying learning rate keep the validation loss from turning up.

Where the errors are

Disgust and fear are the hardest classes for every model. Both are rare, fear is often taken for surprise, and disgust for sadness or anger.

ResNet-18, tuned: true emotion (rows) against prediction

angdisfeahapneusadsurangryangry / ang: 83%83angry / dis: 4%4angry / fea: 1%1angry / hap: 2%2angry / neu: 6%6angry / sad: 2%2angry / sur: 2%2disgustdisgust / ang: 10%10disgust / dis: 61%61disgust / fea: 2%2disgust / hap: 3%3disgust / neu: 10%10disgust / sad: 12%12disgust / sur: 2%2fearfear / ang: 4%4fear / dis: 1%1fear / fea: 62%62fear / hap: 2%2fear / neu: 4%4fear / sad: 7%7fear / sur: 20%20happyhappy / ang: 1%1happy / dis: 1%1happy / fea: 0%0happy / hap: 91%91happy / neu: 4%4happy / sad: 1%1happy / sur: 2%2neutralneutral / ang: 1%1neutral / dis: 2%2neutral / fea: 0%0neutral / hap: 2%2neutral / neu: 84%84neutral / sad: 9%9neutral / sur: 3%3sadsad / ang: 2%2sad / dis: 2%2sad / fea: 1%1sad / hap: 1%1sad / neu: 12%12sad / sad: 81%81sad / sur: 1%1surprisesurprise / ang: 2%2surprise / dis: 1%1surprise / fea: 3%3surprise / hap: 1%1surprise / neu: 4%4surprise / sad: 1%1surprise / sur: 87%87

Recall per emotion, all seven tuned models

angdisfeahapneusadsurResNet-18ResNet-18 / ang: 83%83ResNet-18 / dis: 61%61ResNet-18 / fea: 62%62ResNet-18 / hap: 91%91ResNet-18 / neu: 84%84ResNet-18 / sad: 81%81ResNet-18 / sur: 87%87VGGVGG / ang: 83%83VGG / dis: 58%58VGG / fea: 57%57VGG / hap: 92%92VGG / neu: 83%83VGG / sad: 80%80VGG / sur: 86%86DenseNetDenseNet / ang: 83%83DenseNet / dis: 60%60DenseNet / fea: 63%63DenseNet / hap: 92%92DenseNet / neu: 81%81DenseNet / sad: 81%81DenseNet / sur: 88%88CCTCCT / ang: 79%79CCT / dis: 46%46CCT / fea: 50%50CCT / hap: 91%91CCT / neu: 80%80CCT / sad: 74%74CCT / sur: 85%85Simple CNNSimple CNN / ang: 79%79Simple CNN / dis: 56%56Simple CNN / fea: 59%59Simple CNN / hap: 90%90Simple CNN / neu: 79%79Simple CNN / sad: 72%72Simple CNN / sur: 84%84ConvNeXtConvNeXt / ang: 77%77ConvNeXt / dis: 49%49ConvNeXt / fea: 52%52ConvNeXt / hap: 89%89ConvNeXt / neu: 79%79ConvNeXt / sad: 70%70ConvNeXt / sur: 82%82ViTViT / ang: 71%71ViT / dis: 38%38ViT / fea: 45%45ViT / hap: 88%88ViT / neu: 79%79ViT / sad: 68%68ViT / sur: 81%81
Test set, in % of each true emotion. Disgust and fear are the hardest classes for every model.

Size

DenseNet matches ResNet-18 with 14 times fewer parameters. An ImageNet-pretrained ResNet-18 is no better than the one trained from scratch.

78808284861M10Mparameters (log scale)Simple CNN: 1.27 M parameters, 81.2%VGG: 7.05 M parameters, 84.7%ResNet-18: 11.17 M parameters, 85.1%DenseNet: 0.77 M parameters, 84.6%ViT: 3.73 M parameters, 78.4%ConvNeXt: 3.38 M parameters, 80.1%CCT: 3.88 M parameters, 81.6%Simple CNNVGGResNet-18DenseNetViTConvNeXtCCT
↑ test accuracy (%)
Parameters against test accuracy after tuning.

Part 03 of 05Tuning

How sensitive is each architecture to its settings?

Does the network's shape matter, once the settings are tuned?

20406080ResNet-18VGGDenseNetSimple CNNConvNeXtCCTViTbatch norm: tightno batch norm: wide spread
↑ val macro-F1 after 25 epochs (%)
  • random start
  • TPE
  • default settings
Every trial of the first tuning stage: validation macro-F1 after 25 epochs. Rings: random start; dots: TPE; diamond: default settings.

Optuna tuned all seven with the same budget: 30 trials of 25 epochs, random first, then TPE, over eight settings such as learning rate, warmup, and class weights. The CNNs with batch norm score well almost anywhere; the others only in a narrow band.

What mattered

Warmup mattered most for four models, the learning rate for the two transformers, and class weighting for ResNet-18.

learning rateweight decaywarmupclass weightsbatch sizelabel smoothingaugmentationdropout / drop pathResNet-18ResNet-18 / learning rate: 9%9ResNet-18 / weight decay: 1%1ResNet-18 / warmup: 7%7ResNet-18 / class weights: 63%63ResNet-18 / batch size: 0%0ResNet-18 / label smoothing: 6%6ResNet-18 / augmentation: 3%3ResNet-18 / dropout / drop path: 10%10VGGVGG / learning rate: 20%20VGG / weight decay: 2%2VGG / warmup: 37%37VGG / class weights: 31%31VGG / batch size: 1%1VGG / label smoothing: 6%6VGG / augmentation: 3%3VGG / dropout / drop path: 1%1DenseNetDenseNet / learning rate: 7%7DenseNet / weight decay: 3%3DenseNet / warmup: 60%60DenseNet / class weights: 23%23DenseNet / batch size: 2%2DenseNet / label smoothing: 3%3DenseNet / augmentation: 2%2DenseNet / dropout / drop path: 1%1Simple CNNSimple CNN / learning rate: 13%13Simple CNN / weight decay: 4%4Simple CNN / warmup: 59%59Simple CNN / class weights: 10%10Simple CNN / batch size: 4%4Simple CNN / label smoothing: 1%1Simple CNN / augmentation: 6%6Simple CNN / dropout / drop path: 3%3ConvNeXtConvNeXt / learning rate: 31%31ConvNeXt / weight decay: 3%3ConvNeXt / warmup: 47%47ConvNeXt / class weights: 5%5ConvNeXt / batch size: 1%1ConvNeXt / label smoothing: 4%4ConvNeXt / augmentation: 2%2ConvNeXt / dropout / drop path: 9%9CCTCCT / learning rate: 53%53CCT / weight decay: 0%0CCT / warmup: 26%26CCT / class weights: 4%4CCT / batch size: 0%0CCT / label smoothing: 6%6CCT / augmentation: 5%5CCT / dropout / drop path: 6%6ViTViT / learning rate: 67%67ViT / weight decay: 2%2ViT / warmup: 6%6ViT / class weights: 8%8ViT / batch size: 0%0ViT / label smoothing: 8%8ViT / augmentation: 3%3ViT / dropout / drop path: 5%5
fANOVA importance: the share of the spread in trial scores explained by each setting, in %.

The shape

For the three winners, width, depth, and the number of stages joined the search, with 40 more trials each. The best shapes gained 0.2 points on the test set, within the noise. Smaller networks lost accuracy: the published sizes were already right.

6065707580100k1M10Mparameters (log scale)VGG, trial 0: 7.05 M, 77.8%VGG, trial 1: 3.08 M, 76.2%VGG, trial 2: 0.34 M, 66.7%VGG, trial 3: 0.57 M, 67.8%VGG, trial 4: 1.85 M, 74.3%VGG, trial 5: 3.00 M, 71.3%VGG, trial 6: 2.05 M, 74.9%VGG, trial 7: 0.43 M, 64.9%VGG, trial 8: 0.62 M, 60.2%VGG, trial 9: 0.94 M, 68.5%VGG, trial 10: 0.61 M, 71.4%VGG, trial 11: 2.02 M, 68.8%VGG, trial 12: 2.50 M, 77.1%VGG, trial 13: 7.97 M, 78.0%VGG, trial 14: 4.45 M, 77.2%VGG, trial 15: 13.16 M, 77.9%VGG, trial 16: 9.20 M, 76.5%VGG, trial 17: 9.73 M, 75.9%VGG, trial 18: 7.05 M, 77.6%VGG, trial 19: 2.60 M, 75.6%VGG, trial 20: 13.30 M, 78.3%VGG, trial 21: 15.46 M, 76.7%VGG, trial 22: 15.10 M, 75.3%VGG, trial 23: 8.94 M, 78.1%VGG, trial 24: 3.78 M, 76.0%VGG, trial 25: 5.01 M, 76.3%VGG, trial 26: 9.54 M, 76.4%VGG, trial 27: 13.57 M, 78.6%VGG, trial 28: 16.67 M, 77.7%VGG, trial 29: 14.81 M, 78.1%VGG, trial 30: 14.81 M, 79.1%VGG, trial 31: 13.30 M, 77.4%VGG, trial 32: 12.16 M, 77.8%VGG, trial 33: 15.61 M, 77.6%VGG, trial 34: 8.61 M, 78.2%VGG, trial 35: 6.19 M, 77.1%VGG, trial 36: 11.51 M, 78.3%VGG, trial 37: 13.92 M, 77.6%VGG, trial 38: 7.80 M, 77.1%VGG, trial 39: 16.67 M, 77.7%ResNet-18, trial 0: 11.17 M, 78.3%ResNet-18, trial 1: 5.29 M, 76.5%ResNet-18, trial 2: 0.42 M, 68.0%ResNet-18, trial 3: 0.27 M, 71.7%ResNet-18, trial 4: 2.33 M, 76.8%ResNet-18, trial 5: 3.75 M, 74.4%ResNet-18, trial 6: 1.35 M, 74.9%ResNet-18, trial 7: 0.54 M, 67.3%ResNet-18, trial 8: 0.41 M, 66.4%ResNet-18, trial 9: 0.23 M, 67.1%ResNet-18, trial 10: 0.96 M, 74.9%ResNet-18, trial 11: 2.52 M, 72.0%ResNet-18, trial 12: 4.13 M, 76.8%ResNet-18, trial 13: 7.54 M, 75.6%ResNet-18, trial 14: 7.03 M, 77.4%ResNet-18, trial 15: 16.33 M, 76.7%ResNet-18, trial 16: 7.16 M, 77.6%ResNet-18, trial 17: 16.26 M, 77.9%ResNet-18, trial 18: 23.46 M, 78.1%ResNet-18, trial 19: 13.69 M, 78.7%ResNet-18, trial 20: 11.91 M, 78.0%ResNet-18, trial 21: 15.72 M, 77.5%ResNet-18, trial 22: 24.63 M, 77.2%ResNet-18, trial 23: 6.47 M, 76.0%ResNet-18, trial 24: 9.20 M, 77.0%ResNet-18, trial 25: 11.41 M, 77.7%ResNet-18, trial 26: 21.67 M, 77.3%ResNet-18, trial 27: 12.89 M, 77.4%ResNet-18, trial 28: 9.39 M, 74.5%ResNet-18, trial 29: 22.47 M, 78.7%ResNet-18, trial 30: 18.27 M, 78.1%ResNet-18, trial 31: 19.59 M, 76.7%ResNet-18, trial 32: 16.26 M, 77.2%ResNet-18, trial 33: 20.78 M, 77.4%ResNet-18, trial 34: 14.59 M, 78.5%ResNet-18, trial 35: 24.05 M, 77.3%ResNet-18, trial 36: 12.59 M, 77.2%ResNet-18, trial 37: 16.56 M, 77.1%ResNet-18, trial 38: 12.89 M, 76.7%ResNet-18, trial 39: 16.26 M, 77.9%DenseNet, trial 0: 0.77 M, 76.5%DenseNet, trial 1: 0.86 M, 75.7%DenseNet, trial 2: 0.06 M, 63.8%DenseNet, trial 3: 0.14 M, 69.3%DenseNet, trial 4: 0.21 M, 73.8%DenseNet, trial 5: 0.31 M, 72.9%DenseNet, trial 6: 0.53 M, 75.4%DenseNet, trial 7: 0.08 M, 60.8%DenseNet, trial 8: 0.22 M, 56.5%DenseNet, trial 9: 0.08 M, 68.8%DenseNet, trial 10: 0.22 M, 70.3%DenseNet, trial 11: 0.24 M, 69.2%DenseNet, trial 12: 0.55 M, 75.1%DenseNet, trial 13: 0.85 M, 76.0%DenseNet, trial 14: 0.65 M, 76.0%DenseNet, trial 15: 1.09 M, 75.3%DenseNet, trial 16: 0.58 M, 75.6%DenseNet, trial 17: 0.94 M, 75.2%DenseNet, trial 18: 0.41 M, 75.5%DenseNet, trial 19: 0.28 M, 75.1%DenseNet, trial 20: 0.77 M, 75.6%DenseNet, trial 21: 0.71 M, 75.7%DenseNet, trial 22: 1.58 M, 74.9%DenseNet, trial 23: 1.15 M, 76.0%DenseNet, trial 25: 0.90 M, 75.1%DenseNet, trial 26: 1.19 M, 75.2%DenseNet, trial 27: 0.54 M, 74.4%DenseNet, trial 28: 0.94 M, 73.3%DenseNet, trial 29: 1.49 M, 76.8%DenseNet, trial 30: 0.54 M, 76.0%DenseNet, trial 31: 1.35 M, 75.4%DenseNet, trial 32: 0.52 M, 76.0%DenseNet, trial 33: 0.69 M, 75.3%DenseNet, trial 34: 0.59 M, 74.8%DenseNet, trial 35: 0.48 M, 74.1%DenseNet, trial 36: 0.38 M, 74.3%DenseNet, trial 37: 0.59 M, 73.5%DenseNet, trial 38: 0.35 M, 74.1%DenseNet, trial 39: 0.43 M, 74.6%DenseNet, trial 40: 0.52 M, 73.2%ring: published shape · diamond: best
↑ val macro-F1 after 25 epochs (%)
  • VGG
  • ResNet-18
  • DenseNet
The second tuning stage: width, depth and number of stages join the search for the three winners.

Part 04 of 05Grokking

Does training far longer help?

Can a network generalise long after it has memorised its training set, as in grokking?

20406080100101001,00010,000100ktraining steps (log scale)memorised (step 1,500)half of the rise+11 points
  • normal start, train
  • normal start, validation
  • 3× start, train
  • 3× start, validation
  • 3× start, no weight decay
Simple CNN on 1,000 training faces, MSE loss, AdamW, after Omnigrok (Liu et al. 2023). Dashed: training accuracy; solid: validation accuracy.

A simple CNN on 1,000 training faces, in the setting where grokking was shown on images: large initial weights, MSE loss, weight decay, and 100,000 steps. Validation accuracy rises long after training accuracy reaches 100%, but gradually. There is no sudden jump.

Longer training

The three winners trained 100 epochs at a constant learning rate, then cooled down. None beats its 60-epoch result by more than the noise.

VGG

60708090050100testepochVGG, tuned: 84.5% test after the cooldownVGG, larger shape: 85.5% test after the cooldownVGG, memorize (no regularisation): 81.5% test after the cooldownmemorize run peaks,then overfits

ResNet-18

60708090050100testepochResNet-18, tuned: 84.8% test after the cooldownResNet-18, larger shape: 85.2% test after the cooldownResNet-18, memorize (no regularisation): 80.4% test after the cooldown

DenseNet

60708090050100testepochDenseNet, tuned: 84.0% test after the cooldownDenseNet, larger shape: 85.0% test after the cooldownDenseNet, memorize (no regularisation): 82.5% test after the cooldown
  • tuned
  • larger shape
  • memorize (no regularisation)
Validation accuracy at a constant learning rate. Right edge: test accuracy after a 10-epoch cooldown, which decays the learning rate to zero (warmup-stable-decay).

Overfitting

Without augmentation, label smoothing, and dropout, training accuracy keeps climbing while validation accuracy peaks at epoch 18 and falls: the classic picture of overfitting.

Accuracy

6070809010020406080100epochvalidation peak, epoch 18overfitting: the gap grows
  • training faces
  • validation

Loss

0.000.250.500.751.0020406080100epochvalidation loss turns up
  • training faces
  • validation
Overfitting by design: VGG trained without augmentation, label smoothing or dropout. Training accuracy and loss on fixed training faces.

Batch norm blocks it

VGG, trained on far past memorising, did not grok. With batch norm, weight decay cannot favour a simpler solution. It only raises the effective step size, until training breaks in spikes.

Training loss (log scale)

1e-71e-61e-51e-40.0010.010.112004006008001,000eleven spikes as weight decay shrinks the weights

Validation accuracy

4060802004006008001,000epochcollapse, epoch 206collapse, epoch 522
VGG with batch norm, trained 1,000 epochs past memorising. The spikes match the periodic behaviour of batch norm with weight decay (Lobacheva et al. 2021).

What moves with the late rise

Neural collapse falls tenfold during the late rise. This fits the view of grokking as a switch from lazy to rich learning: the large start first memorises with its random features, then learns new ones.

0.0010.010.11101001,00010,000100ktraining steps (log scale)late rise
↑ NC1 (log scale)
  • normal start
  • 3× start, weight decay 0.1
  • 3× start, 0.01
  • 3× start, none
Neural collapse (Papyan et al. 2020): the spread of features within a class against the spread between classes. It falls while validation accuracy rises late.

Without batch norm

VGG without batch norm behaves like the simple CNN and ends lower. Its weight norm jumps about every 5,000 steps, the slingshot pattern of Adam. The jumps bring no gain.

Weight norm, relative to the usual start

1.01.52.02.520k40k60k80k100kjump: Adam slingshot

Validation accuracy

45.047.550.052.555.020k40k60k80k100ktraining steps
VGG without batch norm on 1,000 faces. Dashed lines in the lower panel mark the jumps, the slingshot pattern of Adam (Thilak et al. 2022).

Part 05 of 05Compression

How much smaller and faster can the winners get without losing accuracy?

Which method works, and why?

77.580.082.585.025102050size (MB, log scale)Output-based low rank, 8× fewer parameters: 6.5 MB, 84.4%Output-based low rank, 4× fewer parameters: 12.8 MB, 85.7%Output-based low rank, 2× fewer parameters: 25.8 MB, 86.2%Tucker-2, 8× fewer parameters: 6.6 MB, 84.7%Tucker-2, 4× fewer parameters: 12.2 MB, 85.5%Tucker-2, 2× fewer parameters: 25.7 MB, 86.1%Spatial split, 8× fewer parameters: 6.5 MB, 84.7%Spatial split, 4× fewer parameters: 12.9 MB, 85.6%Spatial split, 2× fewer parameters: 25.7 MB, 85.9%int8 alonelow rank_2x + int8: 6.6 MB, 86.2%low rank_4x + int8: 3.4 MB, 85.4%low rank_8x + int8: 1.8 MB, 84.4%spatial 2x + int8: 6.6 MB, 86.0%spatial 4x + int8: 3.4 MB, 85.9%spatial 8x + int8: 1.8 MB, 84.8%tucker2 2x + int8: 6.6 MB, 86.0%tucker2 4x + int8: 3.2 MB, 85.4%tucker2 8x + int8: 1.8 MB, 84.8%16× smaller,same accuracy
  • Output-based low rank
  • Tucker-2
  • Spatial split
  • + int8
  • Same size, from scratch
  • uncompressed
ResNet-18. Dashed: one threshold for all layers, no fine-tuning. Solid: ranks chosen per layer, then 10 epochs of repair. Crosses: int8. Squares: same size, trained from scratch.

Four methods, alone and combined: output-based low rank, Tucker-2, a spatial split of each 3 × 3 kernel, and int8. With ranks chosen per layer, a short repair, and int8, ResNet-18 becomes 16 times smaller at its original test accuracy.

Why it works

The weights are close to full rank, but the layer outputs are not. In VGG's last convolution, 7 of 616 directions hold 95% of the output variance. Methods that compress the outputs win.

025507595125102050100200500number of directions kept (log scale)7 of 616201 of 616
  • last conv, outputs
  • last conv, weights
  • early conv, outputs
  • early conv, weights
Cumulative share of variance kept by the leading directions of two VGG layers.

Ranks per layer, then repair

One threshold for all layers breaks VGG: it cuts the last layers below the 6 directions that 7 classes need. Ranks chosen per layer from their measured effect avoid this, and 10 epochs of repair recover most of a deep cut.

020406080after compressionafter repairvgg/low_rank_2x: 86.2%vgg/low_rank_2x: 85.9%vgg/low_rank_4x: 85.8%vgg/low_rank_4x: 85.5%vgg/low_rank_8x: 83.9%vgg/low_rank_8x: 84.8%vgg/spatial_2x: 86.0%vgg/spatial_2x: 85.8%vgg/spatial_4x: 30.1%vgg/spatial_4x: 77.0%vgg/tucker2_2x: 86.3%vgg/tucker2_2x: 85.4%vgg/tucker2_4x: 56.9%vgg/tucker2_4x: 83.1%resnet/low_rank_2x: 85.6%resnet/low_rank_2x: 86.2%resnet/low_rank_4x: 86.1%resnet/low_rank_4x: 85.7%resnet/low_rank_8x: 83.2%resnet/low_rank_8x: 84.4%resnet/spatial_2x: 85.6%resnet/spatial_2x: 85.9%resnet/spatial_4x: 85.6%resnet/spatial_4x: 85.6%resnet/spatial_8x: 84.5%resnet/spatial_8x: 84.7%resnet/tucker2_2x: 85.4%resnet/tucker2_2x: 86.1%resnet/tucker2_4x: 85.1%resnet/tucker2_4x: 85.5%resnet/tucker2_8x: 84.5%resnet/tucker2_8x: 84.7%densenet/low_rank_2x: 85.0%densenet/low_rank_2x: 85.5%densenet/low_rank_4x: 48.3%densenet/low_rank_4x: 82.4%densenet/low_rank_8x: 7.9%densenet/low_rank_8x: 77.2%
  • VGG
  • ResNet-18
  • DenseNet
Validation accuracy of every compressed model before and after 10 epochs of repair.

VGG and DenseNet

VGG holds 4 and 8 times fewer parameters only with low rank. DenseNet, already small, holds 2 times and breaks in int8.

VGG

77.580.082.585.025102050size (MB, log scale)Output-based low rank, 8× fewer parameters: 7.0 MB, 84.8%Output-based low rank, 4× fewer parameters: 13.3 MB, 85.5%Output-based low rank, 2× fewer parameters: 28.2 MB, 85.9%Tucker-2, 4× fewer parameters: 14.1 MB, 83.1%Tucker-2, 2× fewer parameters: 28.0 MB, 85.4%Spatial split, 4× fewer parameters: 14.1 MB, 77.0%Spatial split, 2× fewer parameters: 28.3 MB, 85.8%int8 alonelow rank_2x + int8: 7.1 MB, 86.2%low rank_4x + int8: 3.5 MB, 85.5%low rank_8x + int8: 1.9 MB, 84.6%spatial 2x + int8: 7.2 MB, 85.8%spatial 4x + int8: 3.6 MB, 76.3%tucker2 2x + int8: 7.1 MB, 85.8%tucker2 4x + int8: 3.7 MB, 83.3%
VGG, same routes.

DenseNet

77.580.082.585.0125size (MB, log scale)Output-based low rank, 8× fewer parameters: 1.2 MB, 77.2%Output-based low rank, 4× fewer parameters: 1.9 MB, 82.4%Output-based low rank, 2× fewer parameters: 3.3 MB, 85.5%int8 alonelow rank_2x + int8: 1.5 MB, 78.4%low rank_4x + int8: 1.1 MB, 69.1%low rank_8x + int8: 0.9 MB, 19.9%
DenseNet, same routes.

Speed depends on the hardware

On the GPU, every factorised model is slower for one face: more, thinner layers cost more launches. On one CPU thread, the closest to a browser, a compressed ResNet-18 is 6.8 times faster at 0.7 points less.

ResNet-18, int8n/aResNet-18, int8, CPU, one thread, one face: 2.0×2.0×ResNet-18, Tucker-2, 8×ResNet-18, Tucker-2, 8×, GPU, one face: 0.6×0.6×ResNet-18, Tucker-2, 8×, CPU, one thread, one face: 3.6×3.6×ResNet-18, spatial split, 8×ResNet-18, spatial split, 8×, GPU, one face: 0.7×0.7×ResNet-18, spatial split, 8×, CPU, one thread, one face: 3.2×3.2×ResNet-18, spatial 8× + int8n/aResNet-18, spatial 8× + int8, CPU, one thread, one face: 6.8×6.8×VGG, int8n/aVGG, int8, CPU, one thread, one face: 2.1×2.1×VGG, low rank, 8×VGG, low rank, 8×, GPU, one face: 0.6×0.6×VGG, low rank, 8×, CPU, one thread, one face: 2.6×2.6×VGG, low rank 8× + int8n/aVGG, low rank 8× + int8, CPU, one thread, one face: 5.2×5.2×DenseNet, low rank, 2×DenseNet, low rank, 2×, GPU, one face: 0.5×0.5×DenseNet, low rank, 2×, CPU, one thread, one face: 0.9×0.9×as fast0×2×4×6×times faster than uncompressed
  • GPU, one face
  • CPU, one thread, one face
Times faster than the uncompressed model for one face. Medians, eager PyTorch, fp32 except int8.

The fair baseline

A network trained small from scratch is as good for VGG and ResNet-18, and better for DenseNet. Compression saves a training run; it finds no network that training would miss.

758085test accuracy (%)VGG, 4× fewer parametersVGG, 8× fewer parametersResNet-18, 4× fewer parametersResNet-18, 8× fewer parametersDenseNet, 4× fewer parametersDenseNet, 8× fewer parameters
  • trained small from scratch
  • compressed and repaired
Test accuracy at the same size: trained small from scratch (60 epochs) against compressed and repaired.